본 페이지에는 Scatter Traces의 line이나 marker에 색깔을 입히는 방법과 Discrete한 색상 적용하는 방법에 대해서 설명하겠습니다.
*Scatter traces의 color관련 Dict-key 정보 참조
line_color
Code: fig.update_traces(line_color=<VALUE>, selector=dict(type='scatter'))
Type: color
Sets the line color.

marker_color
Code: fig.update_traces(marker_color=<VALUE>, selector=dict(type='scatter'))
Type: color or array of colors
Sets the marker color. It accepts either a specific color or an array of numbers that are mapped to the colorscale relative to the max and min values of the array or relative to `marker.cmin` and `marker.cmax` if set.

marker_line_color
Code: fig.update_traces(marker_line_color=<VALUE>, selector=dict(type='scatter'))
Type: color or array of colors
Sets the marker.line color. It accepts either a specific color or an array of numbers that are mapped to the colorscale relative to the max and min values of the array or relative to `marker.line.cmin` and `marker.line.cmax` if set.
*color 값 적용 방법 추가 설명 : hex 값, rgb, hsv, CSS 색상을 작성하여 적용합니다.
The 'color' property is a color and may be specified as:
- A hex string (e.g. '#ff0000')
- An rgb/rgba string (e.g. 'rgb(255,0,0)')
- An hsl/hsla string (e.g. 'hsl(0,100%,50%)')
- An hsv/hsva string (e.g. 'hsv(0,100%,100%)')
- A named CSS color:
aliceblue, antiquewhite, aqua, aquamarine, azure,
beige, bisque, black, blanchedalmond, blue,
blueviolet, brown, burlywood, cadetblue,
chartreuse, chocolate, coral, cornflowerblue,
cornsilk, crimson, cyan, darkblue, darkcyan,
darkgoldenrod, darkgray, darkgrey, darkgreen,
darkkhaki, darkmagenta, darkolivegreen, darkorange,
darkorchid, darkred, darksalmon, darkseagreen,
darkslateblue, darkslategray, darkslategrey,
darkturquoise, darkviolet, deeppink, deepskyblue,
dimgray, dimgrey, dodgerblue, firebrick,
floralwhite, forestgreen, fuchsia, gainsboro,
ghostwhite, gold, goldenrod, gray, grey, green,
greenyellow, honeydew, hotpink, indianred, indigo,
ivory, khaki, lavender, lavenderblush, lawngreen,
lemonchiffon, lightblue, lightcoral, lightcyan,
lightgoldenrodyellow, lightgray, lightgrey,
lightgreen, lightpink, lightsalmon, lightseagreen,
lightskyblue, lightslategray, lightslategrey,
lightsteelblue, lightyellow, lime, limegreen,
linen, magenta, maroon, mediumaquamarine,
mediumblue, mediumorchid, mediumpurple,
mediumseagreen, mediumslateblue, mediumspringgreen,
mediumturquoise, mediumvioletred, midnightblue,
mintcream, mistyrose, moccasin, navajowhite, navy,
oldlace, olive, olivedrab, orange, orangered,
orchid, palegoldenrod, palegreen, paleturquoise,
palevioletred, papayawhip, peachpuff, peru, pink,
plum, powderblue, purple, red, rosybrown,
royalblue, rebeccapurple, saddlebrown, salmon,
sandybrown, seagreen, seashell, sienna, silver,
skyblue, slateblue, slategray, slategrey, snow,
springgreen, steelblue, tan, teal, thistle, tomato,
turquoise, violet, wheat, white, whitesmoke,
yellow, yellowgreen
line_color
code: go.scatter의 line_color 혹은 line의 dict containing 구조로 color의 값을 적용
import plotly
import plotly.graph_objects as go

x1 = [ 1, 2, 3, 4, 5 ]
y1 = [ 1, 5, 4, 8, 11 ]

x2 = [ 1, 2, 3, 4, 5 ]
y2 = [ 10, 9, 6, 3, 0 ]

fig = go.Figure()
trace1 = go.Scatter( x=x1, y=y1, mode='lines', line_dash="solid", line_width=4, line_color='black' )
trace2 = go.Scatter( x=x2, y=y2, mode='lines', line=dict(dash="longdashdot", width=10, color='#000000') )

fig.add_trace( trace1 )
fig.add_trace( trace2 )

fig.show()
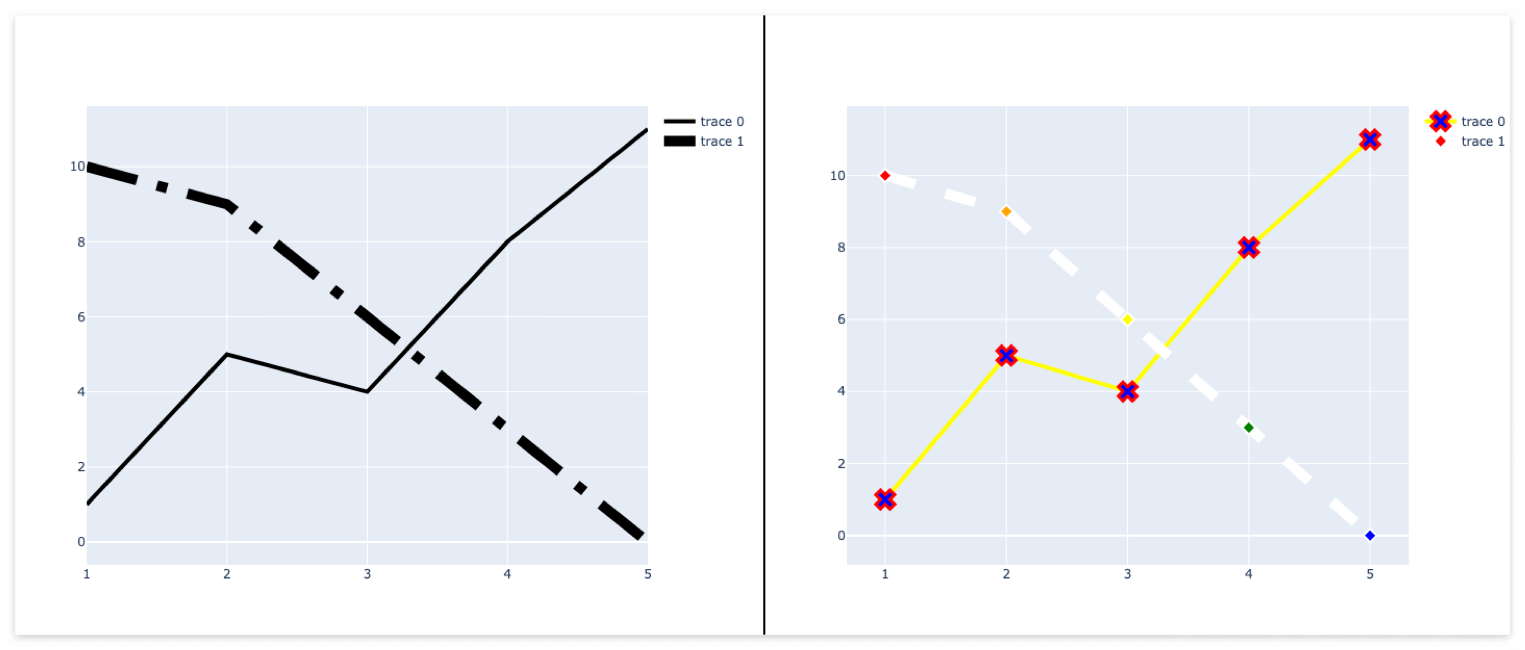
marker_color, marker_line_color
code: go.scatter의 marker_color, marker_line_color 혹은 marker의 dict containing 구조로 color의 값을 적용
*두번째 trace의 각각의 marker 색상은 list로 따로 지정하였습니다.
import plotly
import plotly.graph_objects as go

x1 = [ 1, 2, 3, 4, 5 ]
y1 = [ 1, 5, 4, 8, 11 ]

x2 = [ 1, 2, 3, 4, 5 ]
y2 = [ 10, 9, 6, 3, 0 ]

fig = go.Figure()
trace1 = go.Scatter(
        x=x1, y=y1,
        mode='markers+lines',
        marker_size=16, marker_symbol='x', marker_line=dict(width=3), marker_color='blue', marker_line_color='red',
        line_dash="solid", line_width=4, line_color='yellow',
        )
trace2 = go.Scatter(
        x=x2, y=y2,
        mode='markers+lines',
        marker =dict( size= 10, symbol='diamond', line=dict(width=2), color=['red', 'orange', 'yellow', 'green', 'blue',] ),
        line   =dict( dash='dash', width=10, color='#ffffff' ),
        )
fig.add_trace( trace1 )
fig.add_trace( trace2 )

fig.show()
Output
추가적인 정보는 "Python Figure Reference: scatter Traces" 페이지를 참고 부탁드립니다.